The Rising Tide of Washington’s State-Wide Emissions
The Rising Tide of Washington’s State-Wide Emissions
Washington CaI
Sunday, 26th March 2023
Megha Jha and Craig Rocha
Key Takeaways
Washington’s total state emissions increased by 6.91% from 95.5 MMTCO2e to 102 MMTCO2e between 2018-2019.
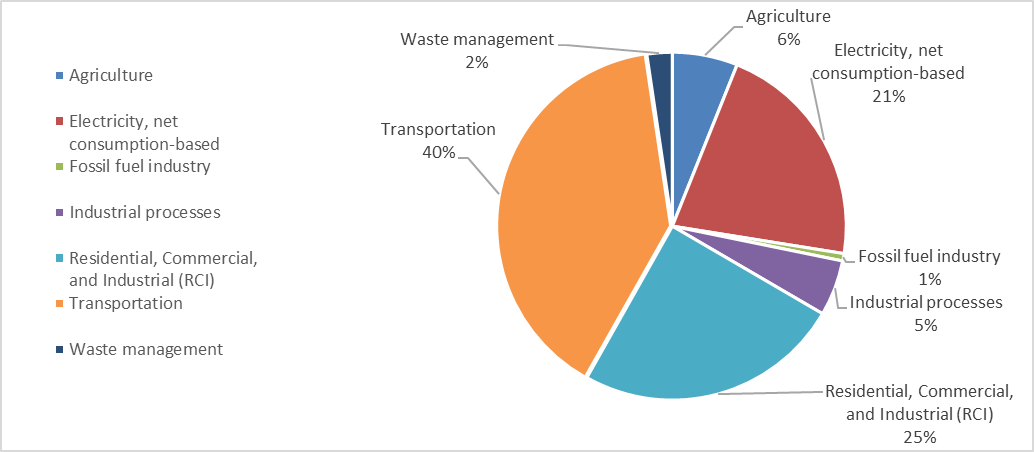
The transportation sector is the largest contributor to emissions within the state at 40.22 MMTCO2e emissions in 2019, closely followed by the Residential, Commercial, and Industrial (RCI) sectors at 25.3 MMTCO2e emissions in the same year.
The state’s electricity sector observed a high demand for energy that was driven by a decrease in river flow and hydropower generation, coupled with extreme weather conditions.
The GHG inventory report released by the Washington State Department of Ecology provides important insights into the sources of greenhouse gas emissions in the state. In this article, we will break down emissions by sector, providing a sectoral outlook into the emission trends within the state.
Washington’s emissions rose by 6.91% between 2018-2019
In 2019, Washington State’s total GHG emissions were approximately 102 million metric tons of carbon dioxide equivalent (MMTCO2e), which represents a 6.91% increase from 2018. This represents a 9.2% increase from the 1990s baseline emissions of 93.5 MMTCO2e.
Total Annual State Emissions Across Years (MMTCO2e)
The state’s established statutory GHG emission limits require Washington to reduce emissions:
By 2020 to 1990 levels
By 2030 to 45% below 1990 levels
By 2040 to 70% below 1990 levels
By 2050 to 95% below
45% below 1990 levels and achieve net-zero emissions
However, the latest emission data raises cause for concern as the emission trends observe an upward trajectory.
Sectoral Breakdown of 2019 Emissions (MMTCO2e)
The transportation sector led Washington’s emissions increase
One of the key findings of the report is that the transportation sector is the largest contributor to emissions in Washington State, accounting for 45.8% of total emissions in 2019. This is consistent with the trend observed in recent years, where transportation has been the largest contributor to the state’s GHG emissions.
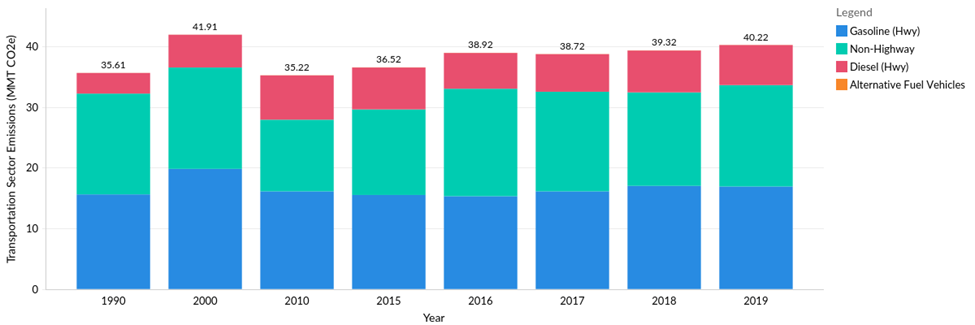
Transportation Sector Emissions YoY (MMTCO2e)
Despite the consistency in the trend line of this sector, emissions from the transportation sector in 2019 were 4% higher than the prior three-year average and 14% above the 1990 total of 35.5 MMT CO2e. The chart above shows that within the transportation sector, the highest emissions were recorded under Gasoline (highway) at 16.9 MMTCO2e, closely followed by Non-Highway emissions at 16.7 MMTCO2e. Between 1990 and 2019, gasoline (highway) emissions increased by 9% from 15.6 MMT CO2e to 16.9 MMT CO2e. Comparatively, Non-Highway emissions only increased by 0.6% from 16.6 MMTCO2e in 1990 to 16.7 MMTCO2e in 2019. The second-largest sector contributing to emissions was the RCI sector, which accounted for 25% of total emissions in 2019. This includes emissions from activities such as manufacturing, construction, and mining.
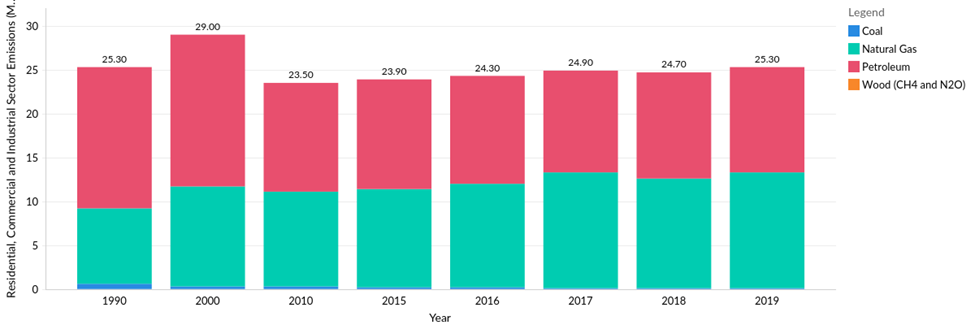
Residential, Commercial and Industrial (RCI) Sector Emissions YoY (MMTCO2e)
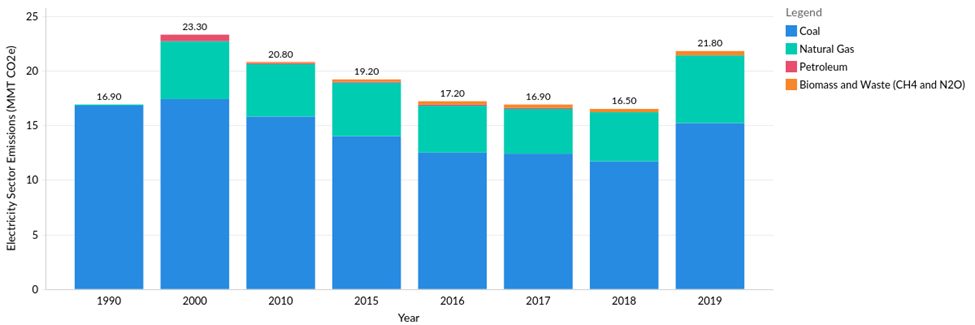
The third-largest sector was the electricity sector, which accounted for 21% of total emissions in 2019.
Electricity Sector Emissions YoY (MMTCO2e)
The higher emissions within this sector in 2019 were a result of the rise in demand for energy that was driven by a decrease in river flow and hydropower generation, coupled with extreme weather conditions. In order to meet the increased demand, carbon-intensive resources such as coal and natural gas were utilized.
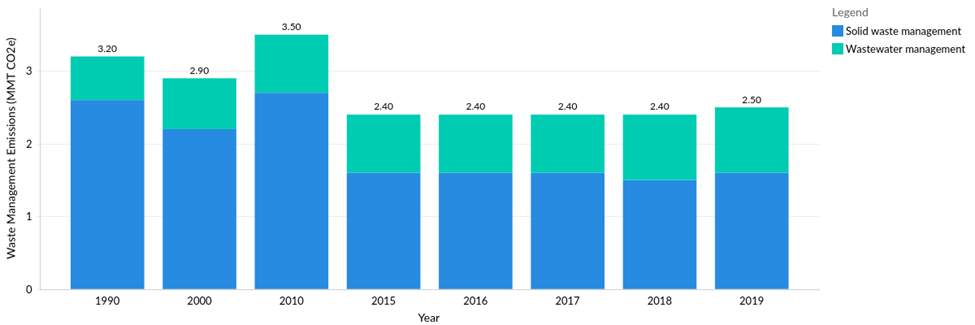
Waste Management Sector Emissions YoY (MMTCO2e)
The waste management sector observed a 4.17% increase in emissions from 2.4 MMTCO2e to 2.5 MMTCO2e and accounted for 2% of the state’s total emissions.
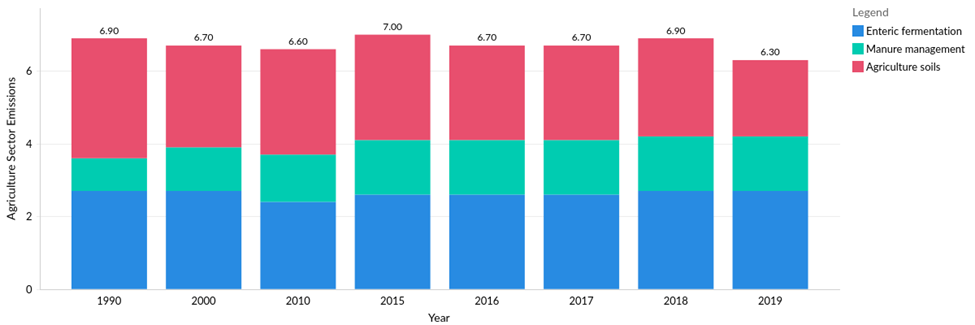
The agricultural sector observed an 8.7% decline in emissions
The agricultural sector noted a decline in emissions, accounting for 6% of the state’s total emissions in 2019. The report shows that emissions from the agricultural sector in Washington State have been relatively stable over the past few years and have actually declined slightly in recent years.
Agricultural Sector Emissions YoY (MMTCO2e)
There are several reasons why the agricultural sector in Washington State has seen a decline in emissions. One of the key factors could be the adoption of renewable energy sources by Washington’s farmers to power their farms. For example, many farms are installing solar panels to generate electricity, which reduces their reliance on fossil fuels. In addition to this, the state government has also implemented policies and programs aimed at reducing emissions from the agricultural sector. For example, the state’s Clean Energy Transformation Act includes provisions to support the adoption of renewable energy and energy efficiency measures on farms.
Conclusion
Overall, the GHG inventory report provides valuable insight into the sources of emissions in Washington State, highlighting the need for continued efforts to reduce emissions across all sectors. It is clear that transportation and industrial activities are the largest contributors to emissions, and thus should be a focus for mitigation efforts moving forward. Analyst Contact:
 Sunday, 26th March 2023
 Megha Jha and Craig Rocha
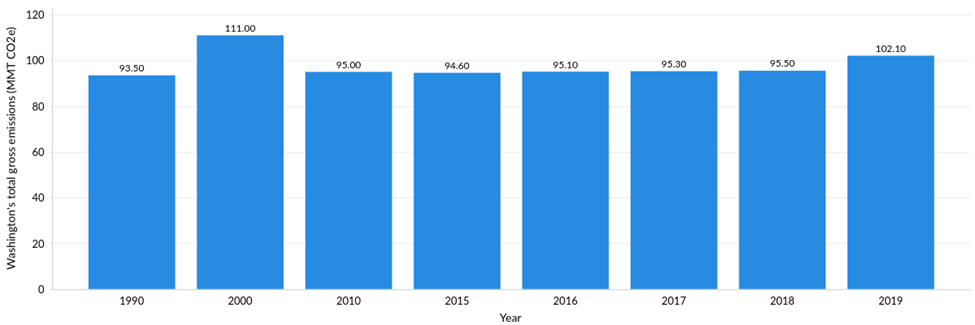
 Articles
 Interviews
 News
News