- Markets
- Cap & Trade
- Clean Fuels Standard
- Carbon Offsets
- Carbon Linked Mechanisms
- Get to Know
- Market Coverage
- Cap & Trade
- Clean Fuels Standard
- Carbon Offsets
- Carbon Linked Mechanisms
- Use Cases
- About us
- Membership Plans
- CAFÉ
- Cap-and-Trade
- Clean Fuel Standards
- Carbon Offsets
- Price Commentary
- Clean Fuels Weekly Commentary: Market participants react negatively to CARB Public Workshop
Clean Fuels Weekly Commentary: Market participants react negatively to CARB Public WorkshopRFSOR CFPBC LCFSCA LCFS Wednesday, 17th April 2024
 Harsh Patel
This Week’s Highlights:
(8th-12th April)
- CARB’s public workshop discussion centered on four scenarios, 5%, 7%, and 9% CI reduction targets, along with Double Auto-Acceleration Mechanism (AAM). The market reacted negatively, leading to a 6.20% price plunge between 10th and 11th April.
- A total of 184,146 credits were exchanged as the Type 1 trades, a 27.10% decline week-over-week (WoW). All non-zero trades also increased by 34.27% as 1,678,615 credits were traded in CA LCFS.
- The average LCFS spot credit prices decreased by 2.91% WoW to reach $63.20/MT last week, also on 16th April the average LCFS spot price was $60.75/MT.
- The weekly average CA LCFS credit price was $65.04/MT for Type 1 transfers, an increase of 0.11% from the past week, and All Non-Zero transfers decreased by 0.74% in prices.
- In the RFS market, D3 prices remained constant while D4, D5 and D6 RIN prices fell.
- D4 RIN prices declined by 5.45%, which can be attributed further narrowing of the BOHO spread after reaching its widest level in three months the week prior.
cCarbon’s Market View
CARB hosted a public workshop on 10th April, amidst the calls from various participants to cap crop-based biofuels, phase out RNG credits, among other things. CARB presented the following four scenarios at the workshop:
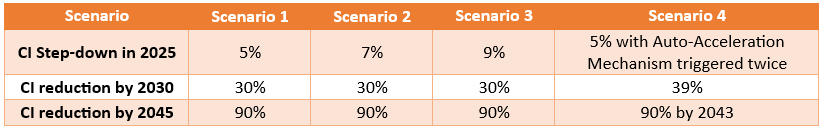
The 7% and 9% scenarios depict smaller increases in biofuel volumes when transitioning from a 7% step-down to a 9% step-down, while the Double Automatic Acceleration Mechanism results in significant changes in biofuel volumes compared to other options. Initially, the market responded negatively to these proposals, as participants expected more stringent targets and sought to address the rapid credit generation from Renewable Diesel, which has been driving down credit prices. Although the market recovered slightly the next day, uncertainty remains regarding program amendments. With the Carryback Credit Acquisition Period nearing its end, prices may experience a slight uptick as participants seek to procure credits to fulfill previous years’ shortfalls.
CA LCFS Weekly Price and Volume Trends
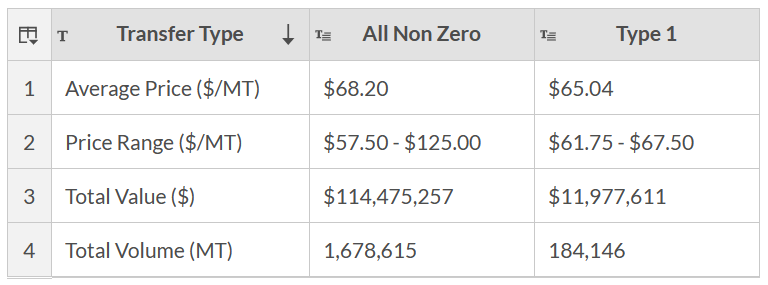
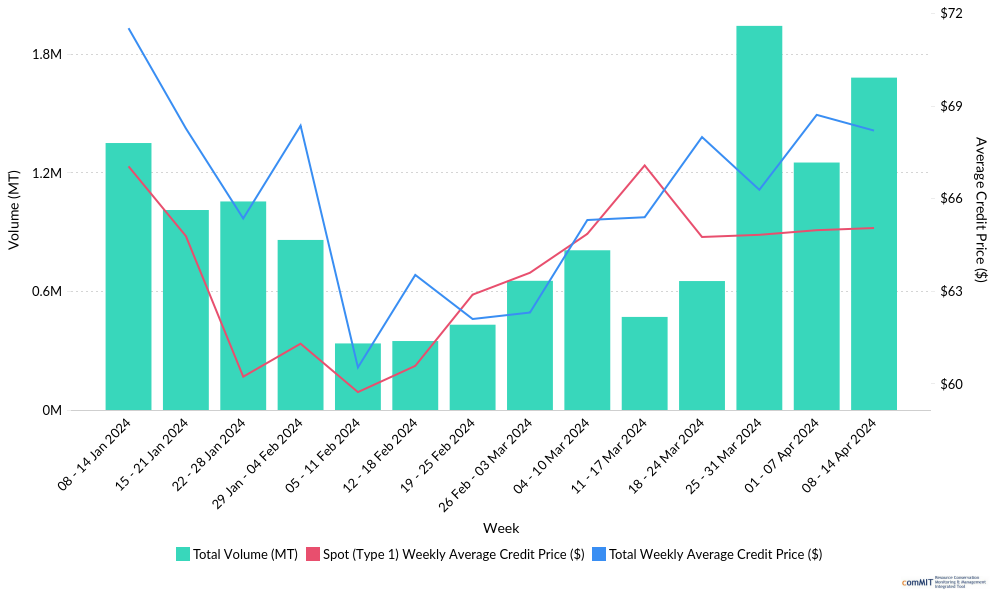
Fig 1. Weekly average credit prices and weekly volumes, Source: California ARB
The average type 1 credit prices, continuing the previous week’s trend, increased marginally by 0.11% to reach $65.04, all non-zero credit prices declined by 0.74% compared to the previous week. A total of 184,146 credits were exchanged in Type 1 trades, marking a decline of 27.10% week-over-week. The transaction volume for All Non-Zero Trades increased from last week to reach 1,678,615 credits.
CA LCFS Daily Average Spot Price
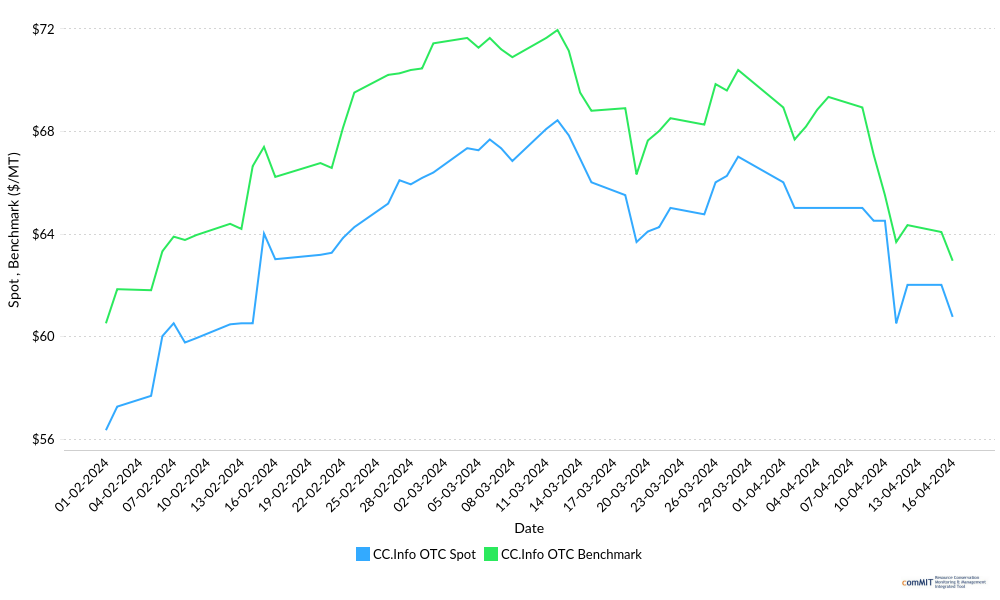
Fig 2. California LCFS Weekly average spot prices and benchmark (*CC.Info OTC: Numbers are an average of broker prices reported to CC.info)
The average LCFS spot credit prices decreased by 2.91% week-over-week to reach $63.20/MT last week, also on the 16th of April the average LCFS spot price was $60.75/MT. The sudden dip in prices, of 6.20%, between 10th and 11th of April is market’s bearish reaction to Public Workshop held on 10th April. The benchmark, which is also the future price of contracts expiring at the end of 2024, was $62.94/MT as of the 16th of April.
CA LCFS Weekly Trade Frequency and Volume
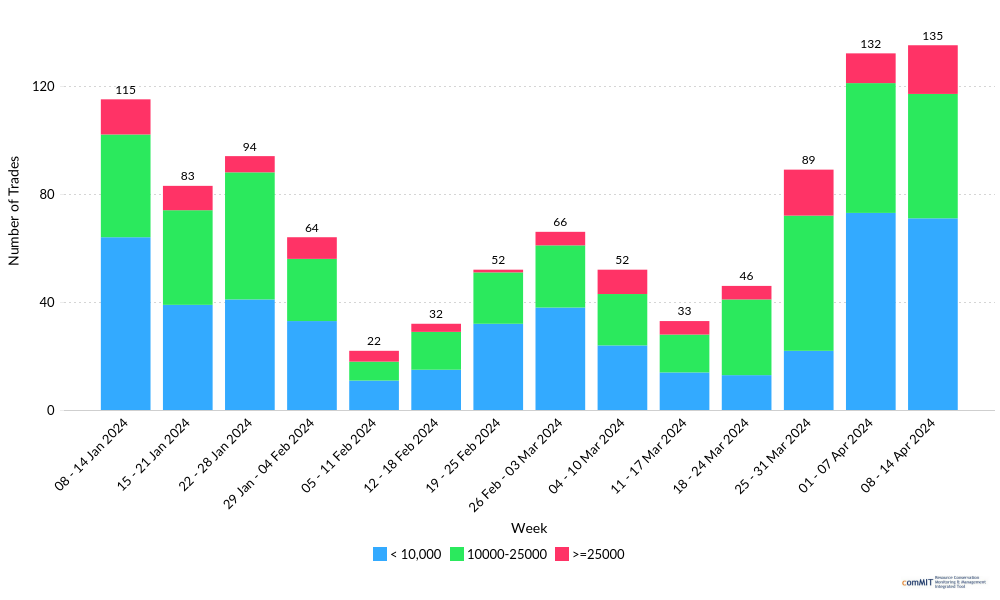
Fig 3. Trade frequency and volume, Source: California ARB
As per the data reported by CARB last week, 135 trades were reported in the market with 18 high-volume trades. The highest transfer by price was at $125.00 for 20,133 credits of Type 2 and the lowest transfer by price last week was at $57.50 per credit of Type 2, reported at a volume of 10,000. The largest volume transfer of 120,000 credits, a Type 2 category for $63.84/MT.
CA LCFS Monthly Volumes and Price Trend
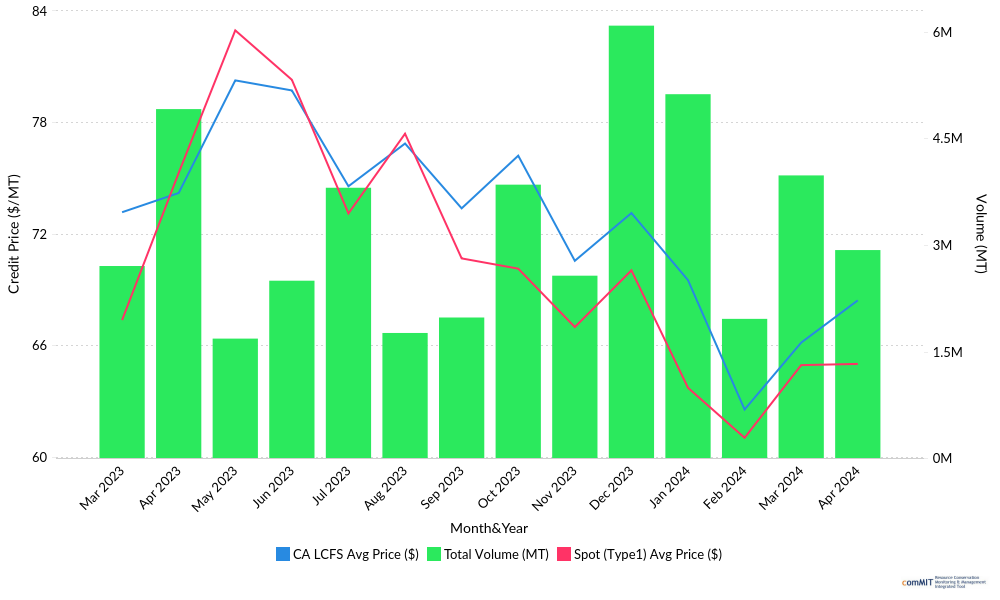
Fig 4. Total monthly volumes and associated prices, Source: California ARB
Following the seasonal trend, after muted activity in the month of February trading bounced back in March. Regulatory certainty around timelines of proposed amendments pushed the trade recovery. The ongoing Carryback Credit Acquisition Period which ends on 30th April generated additional demand for credits and is also reflected in comparatively high activity in the first two weeks of April. Moreover, being the first month of the quarter April is expected to have higher trading volume than the last month following the historical seasonal trend. Simultaneously, prices recovered from February’s historic low as talks around more stringent targets and other tweaks in the proposed amendments gained momentum besides the increase in demand for credits.
CA LCFS Weekly Volume Price Trend
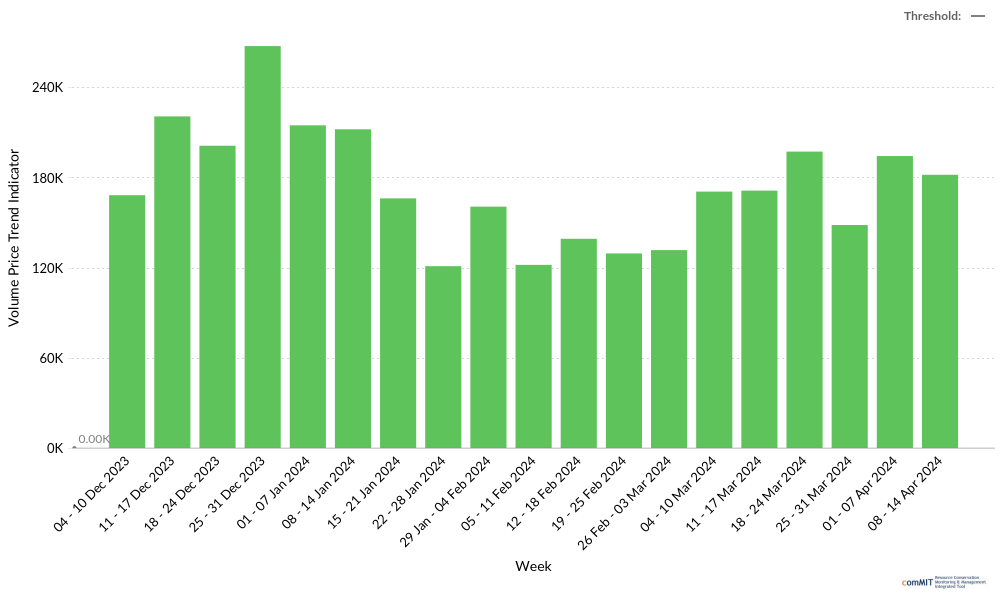
Fig 5. Volume Price Trend indicator for the CA LCFS market, Source: California ARB
The Volume Price Trend Indicator (VPT) helps in identifying the parity between the supply and demand for a stock. The idea behind the indicator is to multiply the market volume of LCFS credits by the percentage change in its price. If the price of the credit declines, the value of the indicator falls. Across 8th-14th April, total VPT decreased by 6.41%, as prices increased marginally over the previous week.
Renewable Fuel Standard (RFS): RIN weekly price trend
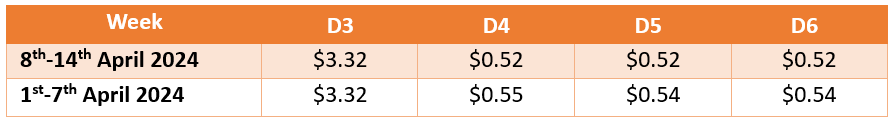
RINs are credits used for compliance and are the “currency” of the RFS program. Renewable fuel producers generate RINs, market participants trade RINs, and obligated parties obtain and then ultimately retire RINs for the compliance list.
In the RFS market, the prices of D3, D4, D5 and D6 decreased. D3 RIN price, which has been rising since the beginning of February, saw no movement while D4 RIN prices declined by 5.45% owing to fall in BOHO spread.
D3: Cellulosic biofuel
D4: Biomass-based diesel
D5: Advanced biofuels (produced from any type of renewable biomass except corn starch ethanol)
D6: Conventional renewable biofuel ethanol derived from corn starch, or any other qualifying renewable fuel
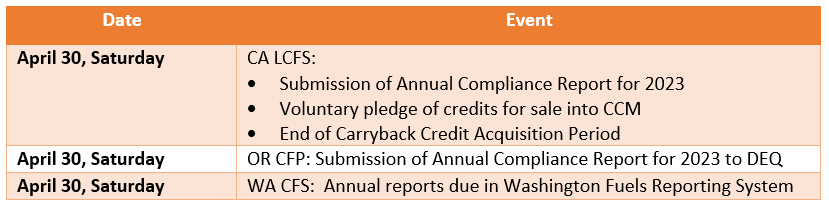
Upcoming dates
Key Clean Fuels Market Developments this week
- EV Realty and GreenPoint Partners form Joint Venture for the buildout of $200 million in EV Charging Hubs EV Realty, Inc., an EV infrastructure development platform powering commercial fleets, announced the formation of a joint venture alongside GreenPoint Partners, to drive the rapid buildout of $200 million of EV Realty’s Powered Properties, high-powered charging hubs for medium and heavy-duty commercial fleet electric vehicles, across California and other strategic U.S. markets. This has the potential to increase EV penetration and credit generation from electricity.
- New Rise Renewables pivots to SAF production New Rise Renewables on April 9 announced work is underway to convert its existing renewable diesel plant located near Reno, Nevada, to sustainable aviation fuel (SAF). SAF production is currently expected to commence this summer. The 3,200 barrel per day (49.06 MMgy) renewable diesel plant originally began operations in mid-2022.
- US court upholds EPA decision to approve California electric-vehicle rules A U.S. appeals court on Tuesday upheld the EPA’s decision to grant California a waiver to set its own tailpipe emissions limits and electric-vehicle requirements. The three-judge panel of the U.S. Court of Appeals for the District of Columbia rejected a legal challenge from 17 Republican-led states and entities that sell or produce liquid fuels.
- A record year for electric and plug-in hybrid vehicles in Washington 2023 was a record year for sales of electric and plug-in hybrid vehicles in Washington! Manufacturer data and newly available industry sales data show EVs and plug-ins accounting for about 20% of all vehicles sold in Washington last year. That’s more than double the national sales average of 9.5%. With transportation being Washington’s biggest source of greenhouse gas emissions.
CC.info Readers Digest
North American Clean Fuels Market: Month-in- Review March 2024
OR CFP Q3 2023: Renewable Diesel continues to push credit bank to new heights
Modeling the Economics of Ethanol Production Coupled with Carbon Capture and Storage | Analyst Note
CA LCFS Q3 2023: New heights of credit bank, can proposed amendments arrest the falling prices?
Analyst Contact
- Harsh Patel (hrpatel@ckinetics.com)
- Bikash Chandra Maharaj (bcmaharaj@ckinetics.com)
Table of Content
- This Week’s Highlights:
- cCarbon’s Market View
- CA LCFS Weekly Price and Volume Trends
- CA LCFS Daily Average Spot Price
- CA LCFS Weekly Trade Frequency and Volume
- CA LCFS Monthly Volumes and Price Trend
- CA LCFS Weekly Volume Price Trend
- Renewable Fuel Standard (RFS): RIN weekly price trend
- Upcoming dates
You might also like Article
 Interviews
 News
News
- Clean Fuel Standards
- Clean Fuels Standard
- Cap & Trade
- Clean Fuels Standard
- Cap & Trade