
- Markets
- Cap & Trade
- Clean Fuels Standard
- Carbon Offsets
- Carbon Linked Mechanisms
- Get to Know
- Market Coverage
- Cap & Trade
- Clean Fuels Standard
- Carbon Offsets
- Carbon Linked Mechanisms
- Use Cases
- About us
- Membership Plans
- CAFÉ
- Cap-and-Trade
- Clean Fuel Standards
- Carbon Offsets
- Price Commentary
- Clean Fuels Weekly Market Watch 19th of July 2023
Clean Fuels Weekly Market Watch 19th of July 2023CA LCFS Wednesday, 19th July 2023
 Sarfaraz Hussain
Key takeaways
- The average LCFS spot credit prices fall by 2.28% week-over-week to reach $72.59/MT last week, also as on 18th of July the average LCFS spot price was $73.63/MT.
- The weekly average CA LCFS credit price was $74.39/MT for Type 1 transfers representing a change (4.06% rise) from the past week and All Non-Zero transfers experienced a 1.36% fall in prices from last week.
- A total of 216,050 credits were exchanged in the Type 1 trade category as the market experienced a 102% week-over-week rise in trade and a 108% rise in the All Non-Zero trade to 1.58 million credits in CA LCFS.
- Next week, CA LCFS credit price is expected to increase to $75.77. The expected range for the next four weeks is $75.56 and $76.52.
- In the RFS market D3 RIN prices gained last week while the D4, D5 and D6 RIN prices remained the same last week.
Clean Fuels Weekly News
BP invests $10 million in WasteFuel, which is planning to develop a global network of plants to convert municipal and agricultural waste into bio-methanol, a biofuel which could play a significant role in decarbonizing hard-to-abate sectors like shipping.
California LCFS Weekly Price and Volume trends

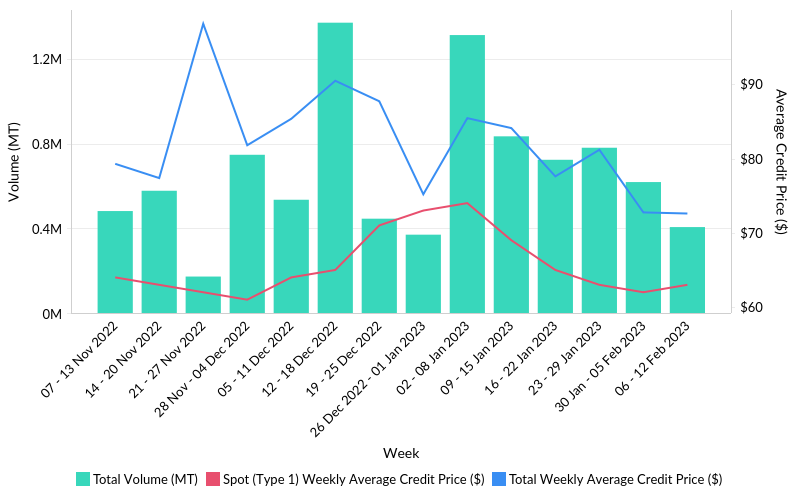
The average Type 1 credit prices gained by 4.06% whereas All Non-Zero credit prices were 1.36% lesser compared to the previous week. The total transaction volume increased for All Non-Zero Trades WOW.
CA LCFS Daily Average Spot Price
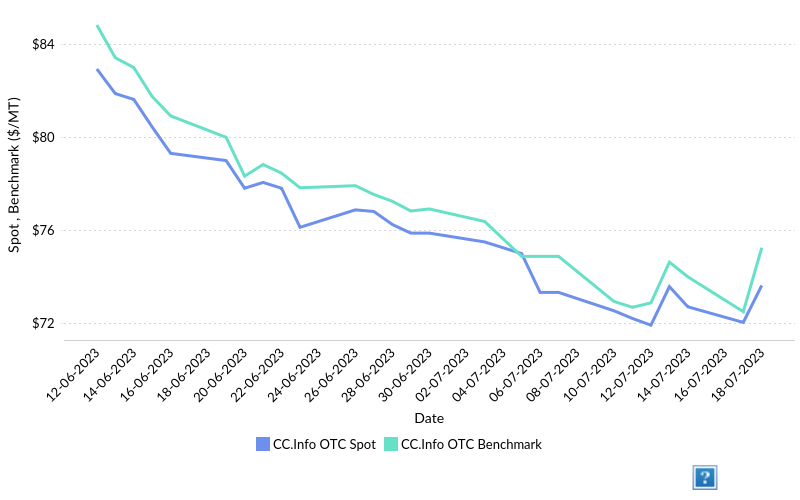
Fig 2. California LCFS Weekly average spot prices and benchmark
*CC.Info OTC: Numbers are an average of broker prices reported to CC.infoThe average LCFS spot credit prices fall by 2.28% week-over-week to reach $72.59/MT last week, also as on 18th of July the average LCFS spot price was $73.63/MT. The benchmark, which is also the future price of contracts expiring at the end of 2023, was $75.25/MT as of 18th of July.
Note: Numbers are an average of broker prices reported to CC.info through various data partnerships.
CA LCFS Weekly Trade Frequency and Volume
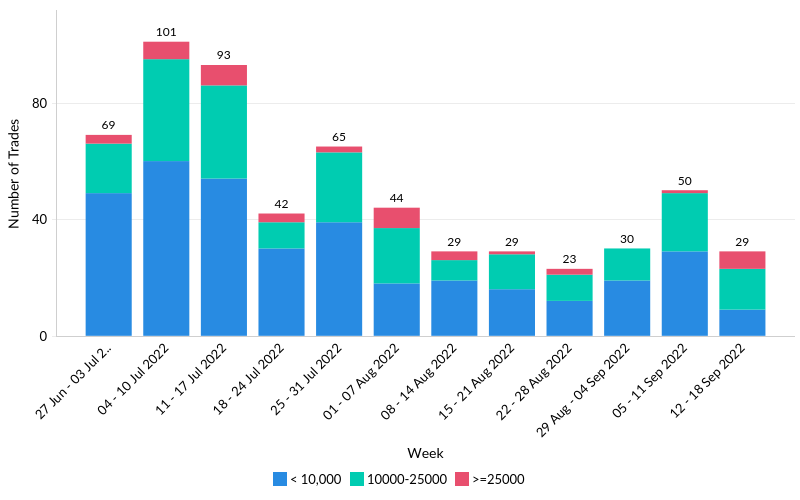
Fig 3. Trade frequency and volume, Source: ARB As per the data reported by CARB, last week 109 trades were reported in the market with 12 high-volume trades. The high transfer this week was at $179.00 per credit of Type 2, reported at a volume of 12,500 credits. The lowest price transfer was of 15,000 Type 2 credits at $61.50/MT. The largest transfer reported 105k credits transferred under Type 2 category at a price of $67.00/MT. Whereas the smallest transfer was a Type 1 transfer of 55 credit at $81.50/MT.
CA LCFS Monthly Volumes and Price Trend
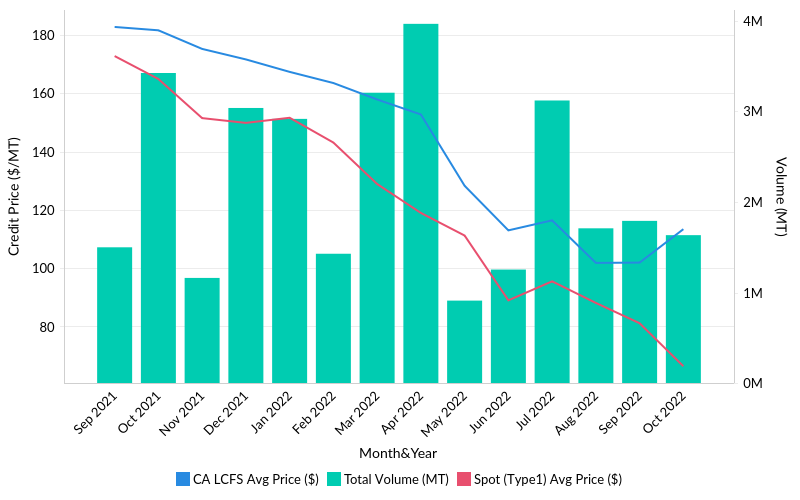
Fig 4. Total monthly volumes and associated prices, Source: ARB The market experienced much lower transaction volumes in the month of June, 48% higher compared to May, with reported credit transaction volume of 2.50 million credit disclosures. Also, there was a rise in Type 1 monthly average price and All Non- Zero monthly average price. Type 1 Monthly average price was $82.76/MT in June, which is 3.27% lower from May.
CA LCFS Weekly Volume Price Trend
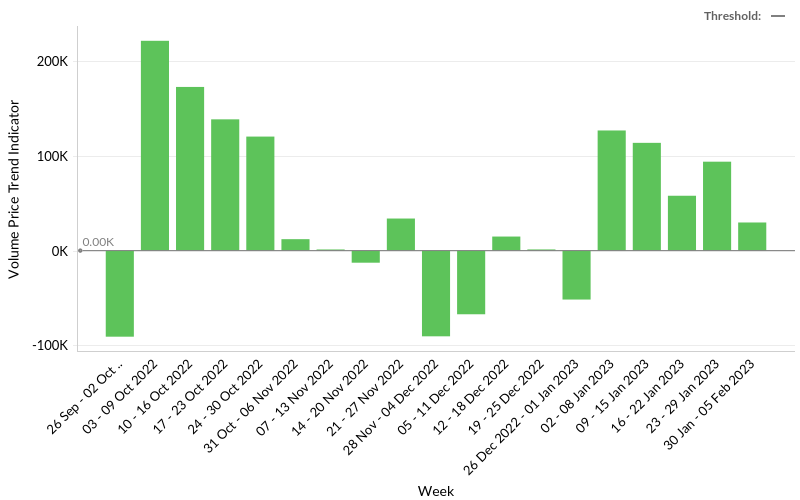
Fig 5. Volume Price Trend indicator for the CA LCFS market, Source: ARB The Volume Price Trend Indicator (VPT) helps in identifying the parity between the supply and demand for a stock. The idea behind the indicator is to multiply the market volume of LCFS credits by the percentage change in its price. If the price of the credit declines, the value of the indicator falls. If the price increases, the value rises. In 10 – 16 Jul 2023 total Volume Price Trend Indicator decreased by 27%
Economist view
- The average weekly price of California Low Carbon Fuel Standard (CA LCFS) credits experienced an increase in the previous week, rising from $71.49 to $74.39.
- The rise in price could be due to fall in the boho spread. Both soybean oil and heating oil experienced an upward movement in prices by approximately 2% and 4.5% respectively but the spread dropped in the last week. On the other hand, Gasoline and Ethanol spread decreased. Though, individually both the commodities went up in the last week. The combined effect of these changes contributed to the increase in the CA LCFS credit price.
- The projected range for the next four weeks is expected to be between $75.56 and $76.52.
- Based on the latest data from the Commodity Futures Trading Commission (CFTC), there was an increase of 0.9 million in open interest positions from 3rd July to 11th July. Producers/Merchants currently hold a net short position of 12.14 million, indicating a decrease compared to the previous week. Managed money, on the other hand, hold a net long position of 7.854 million as of 11th July, which is not a significant change compared with the last week but reflects positive change in the expected price.
- In the upcoming week, it is anticipated that the CA LCFS price will increase to $75.77. Weekly gasoline prices are expected to rise slightly, resulting in a decrease in the ethanol-gasoline spread. Although there might be a mild increase in soybean oil prices next week, the December 2023 contract will continue to be priced lower than the August 2023 contract for the next few weeks. The combined effect of these movements is likely to result in a mild upward movement for CA LCFS in the next week.
OR CFP credit transaction summary
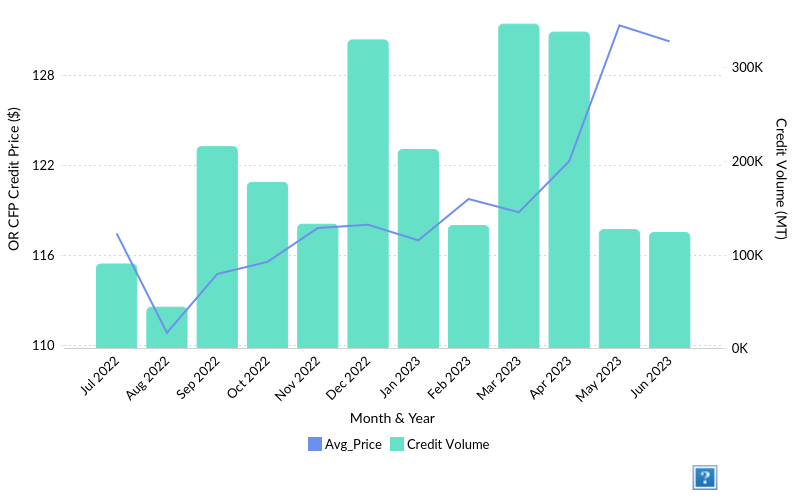
Fig 6. OR CFP total monthly volumes and associated prices, Source: Oregon DEQ DEQ reports Oregon CFP June 2023 credit transaction summary, monthly avg. credit price fall to $130.21 reach after making to three years high of $131.28/MT. DEQ reported a total of 123k credits transferred in June which is 2.3% lower than May. The Oregon CFP credit prices are on continuous rise for past one year, the credits were traded at an avg. price of $146.83/MT on 18th of June, it’s a $5.5 rise since the beginning of the July.
RIN Weekly Market Snapshot
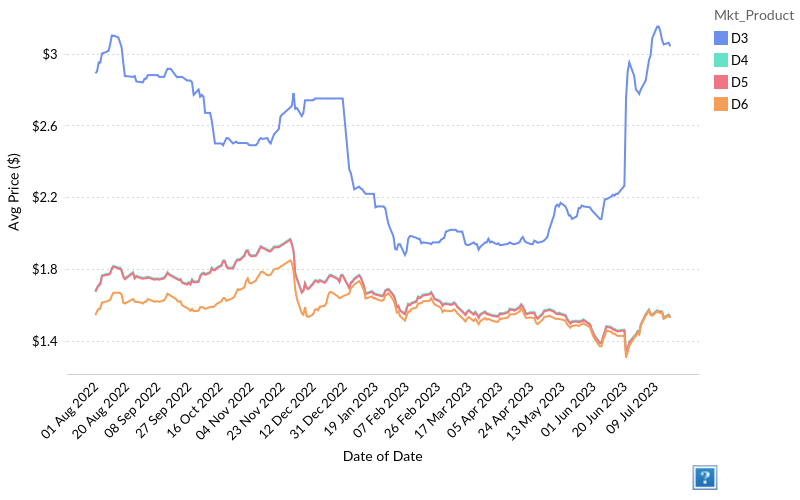
Fig 6. US RFS Daily RIN spot price (Source: OPIS) 
RINs are credits used for compliance and are the “currency” of the RFS program.
Renewable fuel producers generate RINs, market participants trade RINs, and obligated parties obtain and then ultimately retire RINs for compliance list. D3 RIN prices gained last week while the D4, D5 and D6 RIN prices remained the same last week.D3: Cellulosic biofuel
D4: Biomass-based diesel
D5: Advanced biofuels (produced from any type of renewable biomass except corn starch ethanol
D6: Conventional renewable biofuel ethanol derived from corn starch, or any other qualifying renewable fuel
Table of Content
- Key takeaways
- Clean Fuels Weekly News
- California LCFS Weekly Price and Volume trends
- CA LCFS Daily Average Spot Price
- CA LCFS Weekly Trade Frequency and Volume
- CA LCFS Monthly Volumes and Price Trend
- CA LCFS Weekly Volume Price Trend
- Economist view
- OR CFP credit transaction summary
- RIN Weekly Market Snapshot
You might also like Article
 Interviews
 News
News
- Clean Fuel Standards
- Clean Fuels Standard
- Cap & Trade
- Clean Fuels Standard
- Cap & Trade