- Markets
- Cap & Trade
- Clean Fuels Standard
- Carbon Offsets
- Carbon Linked Mechanisms
- Get to Know
- Market Coverage
- Cap & Trade
- Clean Fuels Standard
- Carbon Offsets
- Carbon Linked Mechanisms
- Use Cases
- About us
- Membership Plans
- CAFÉ
- Cap-and-Trade
- Clean Fuel Standards
- Carbon Offsets
- Articles
- 2023 Witnesses a Diversifying Market Despite Declining Supply
2023 Witnesses a Diversifying Market Despite Declining SupplyVCMWCI CCOs & WCOs Monday, 15th January 2024
 Tanay Sawhney
 Key Takeaways
- Credit issuances in 2023 remain below 2022 levels
- Issuances display more diversity as renewables and REDD+ credit volumes fall while energy efficiency credits emerge as a significant contributor to supply
- India and China dominate the supply of credits, largely from renewable energy projects, although their issuances are below 2021 levels
- US Issuances have doubled from 2021 levels
Issuances by Protocol
The supply of credits continued to decline in 2023, although total issuances are still above pre-2021 levels. Renewable Energy was still the largest contributor although with a falling share. In 2020, renewables contributed to close to half of all new issuances, whereas in 2023, their share was less than a third.
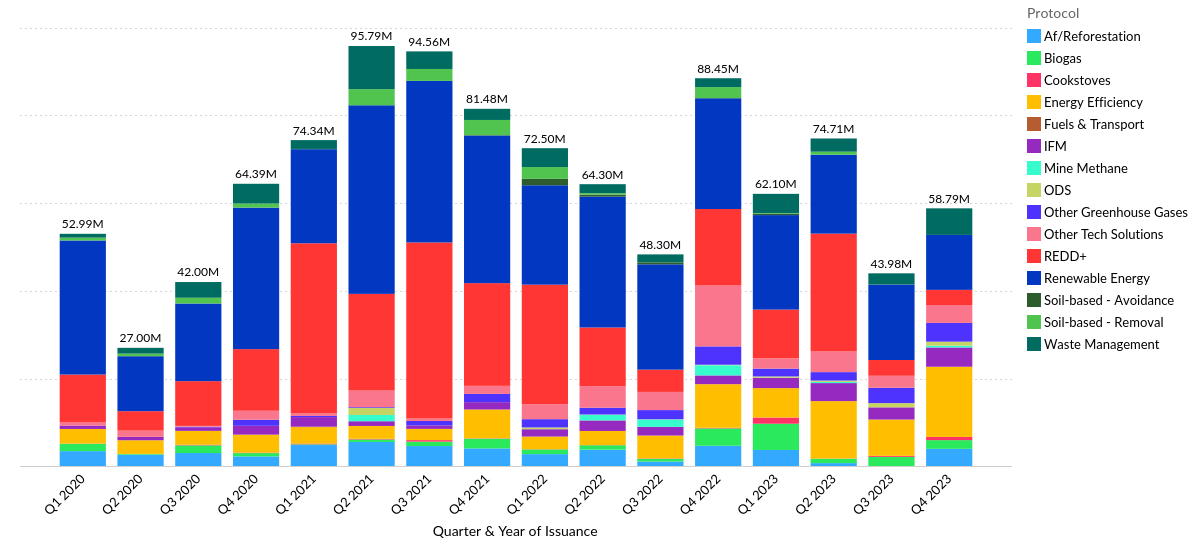
Figure 1: Issuances by Protocol Type
The falling supply of renewable energy credits is due to project lifecycles coming to an end and not being renewed as, starting 2020, Verra and Gold Standard excluded new issuances from renewable energy projects, except for those in Least Developed Countries (LDCs). The other two registries in the global Big4, CAR and ACR, do not issue credits for wind or solar projects.
The declining volumes of issuances are also driven by falling REDD+ issuances. The supply of REDD+ credits halved in 2022 from 2021 volumes and fell further in 2023, rather drastically in the second half of the year. We have seen an intensification of scrutiny of REDD+ projects not only in the media but also within the core VCM infrastructure. As such, Verra suspended issuances pending investigation from projects like the infamous Kariba project in Zimbabwe and the Kasigau Corridor project in Kenya. This loss of faith is mirrored in Article 6 negotiations with many countries objecting to the admission of REDD+ projects into the 6.4 mechanism.
Amidst falling supply of the two historically dominating protocols, energy efficiency credits witnessed a surge in 2023 with new issuances adding up to more than double the 2022 volumes. These credits are almost at par with REDD+ supply, with new issuances overtaking REDD+ issuances in the second half of 2023. Energy efficiency credits also surpassed renewables issuances in the last quarter of 2023. A majority of these credits come from improved cookstoves projects in Africa and Asia.
Issuances by Country
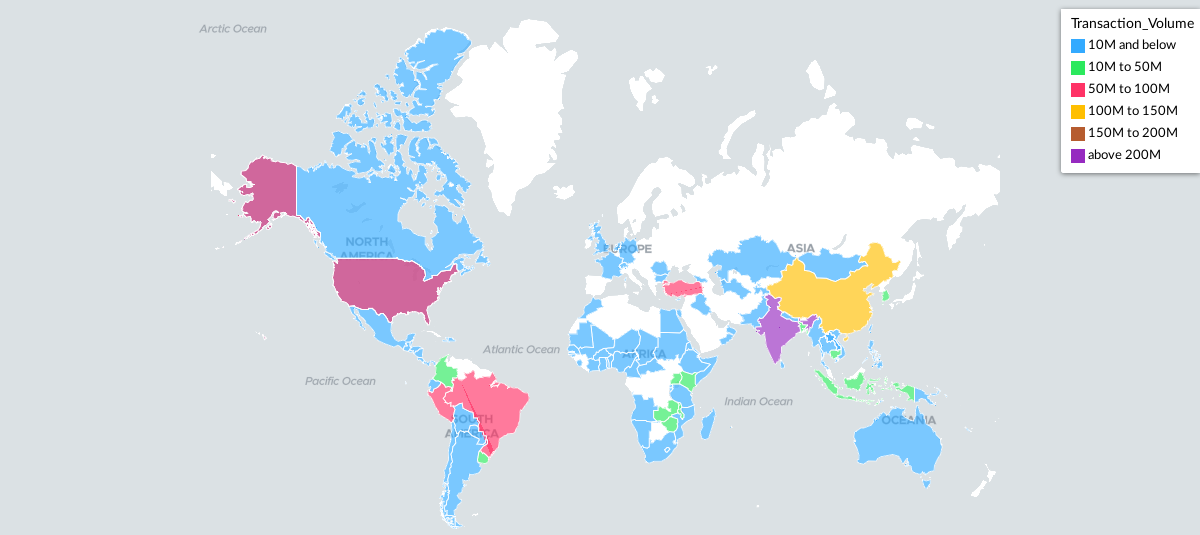
Figure 2: Issuances by Country (2020-2023)
India and China continue to dominate the supply of credits, largely driven by renewable energy projects. The US, Turkey, Brazil and Peru also supply significant volumes of credits. While issuances for India, China, Brazil and Turkey have been below the 2021 levels, American issuances were more than double the 2021 supply in 2023.
As registries exclude newer renewables projects from upper and middle income countries, and older projects come closer to the end of their crediting periods, the supply of such credits from the three big players – India, China and Turkey – will continue to decline over the next few years. However, the shift may encourage the growth of credit supply from other protocols. 2023 saw an increase in the supply of energy efficiency credits from India, biogas credits from China and waste management credits from both China and Turkey from 2022 issuances.
Issuances by Registry
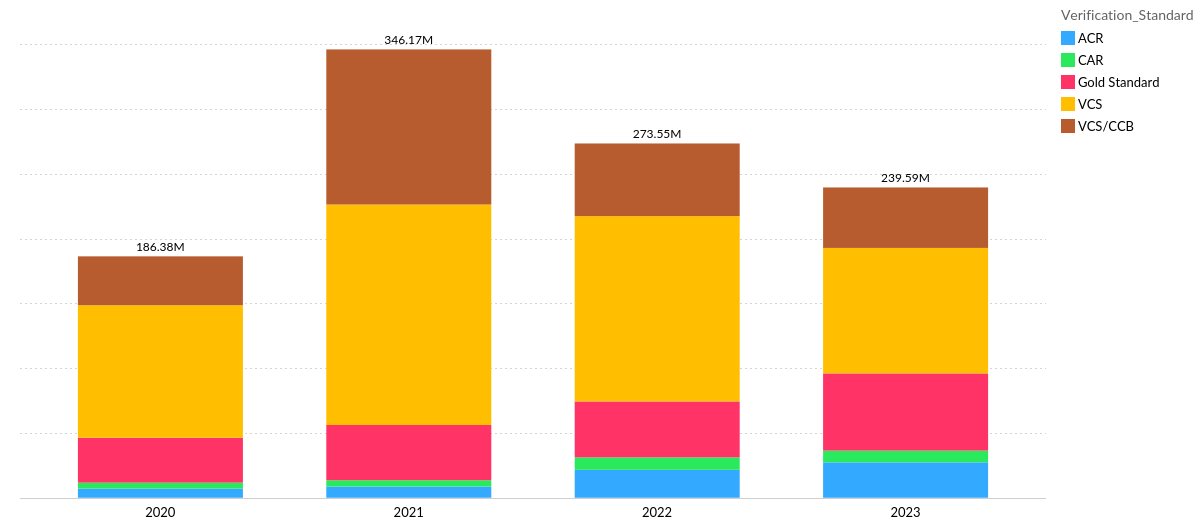
Figure 3: Issuances by Registry
Verra through VCS and CCB continues to lead the issuances of new credits, although its share is declining due to the aforementioned suspension of major REDD+ projects and the end of lifecycles for renewables projects. Despite falling issuances, the supply of credits verified by Gold Standard and ACR increased in volume.
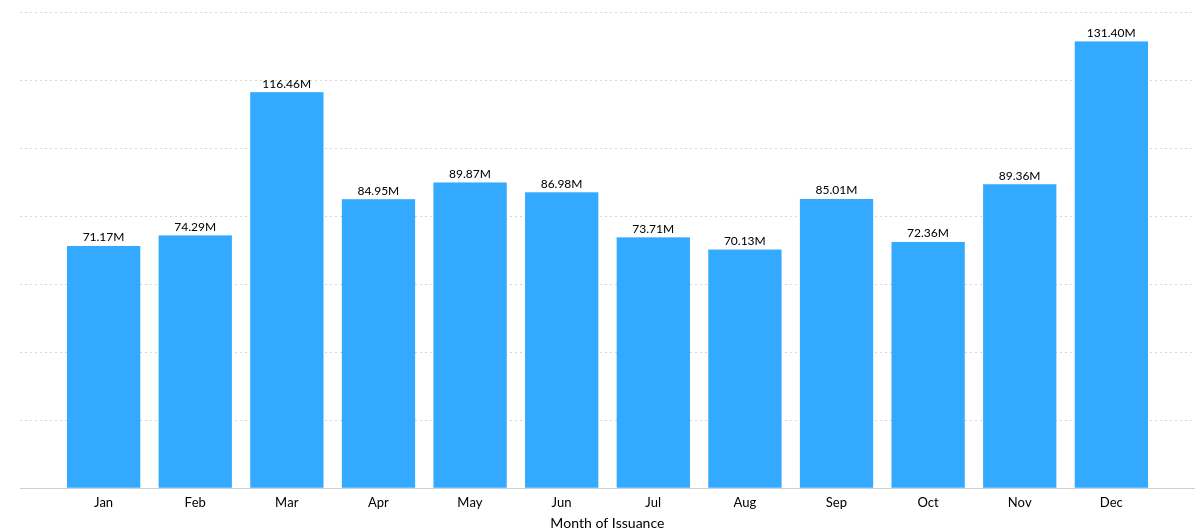
Figure 4: Issuances by Month 2020-2023
With respect to the seasonality of issuances, there appears to be a spike in March and December, before the end of the financial and calendar years respectively, as project developers and issuing entities boost supply before the year ends. It must be noted that this seasonality is less pronounced when compared to the retirements of credits.
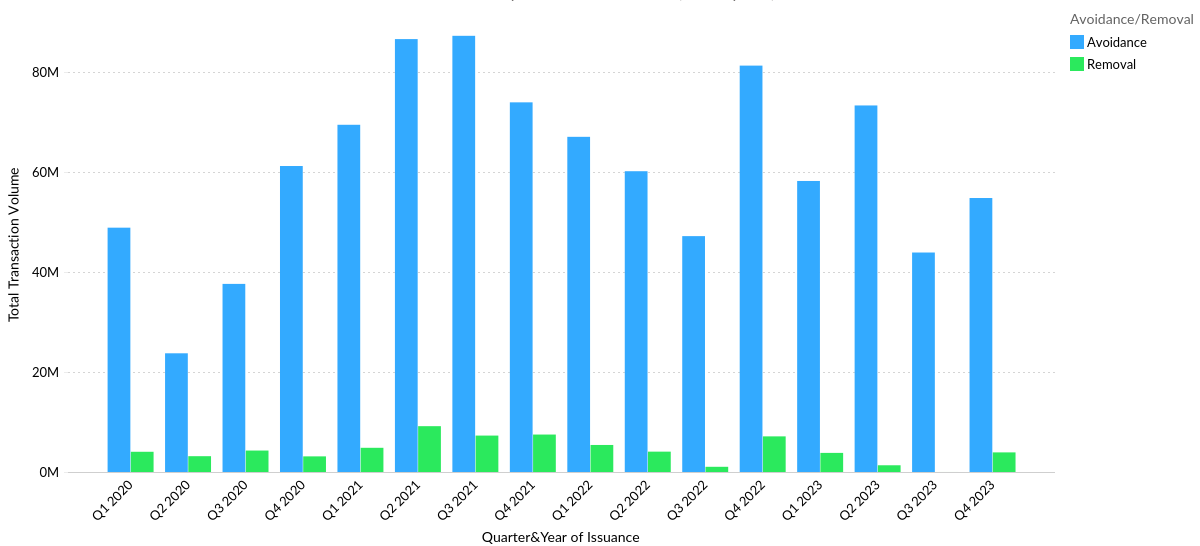
Figure 5: Issuances by Avoidance/Removal
Avoidance credits continue to overtake removal credits, with removals having a relatively negligible share of new issuances in 2023. However, as demand for removal-based credits increases, the market may witness increases in the supply of such credits. Currently, removal credits are generated by only two nature–based protocols – af/reforestation and soil-based removals – with technology-based removals completely non-existent in the overall supply. Despite increasing innovation for technology-based removal methodologies such as DAC, these protocols suffer from various bottlenecks including higher costs, difficulties in scaling operations and in some cases land, water and energy usage.
Issuances by Vintage Year
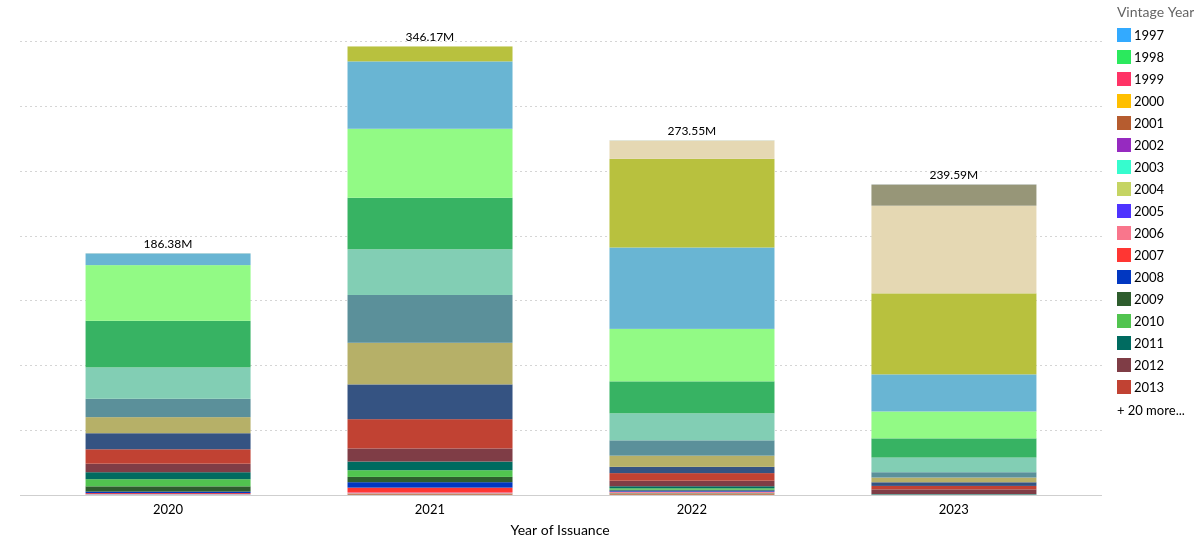
Figure 6: Issuances by Vintage Year
When looking at the supply of credits by vintage year, 2021 was an outlier year not because of massive issuances but rather because of the mass-minting of older vintages. In 2023, more than half of the new issuances came from vintages not more than 2 years old, signifying that the market is slowly clearing older vintages.
Looking at 2024, we might see a more diverse protocol offering in the carbon markets focused on newer vintages. Smaller registries will perhaps grow in volume with Verra’s volumes declining. If the market follows demand, removal-based issuances will increase over the coming years contingent upon large scale feasibility of technology-based removal projects.
You might also like Articles
 Interviews
 News
News
- Clean Fuel Standards
- Clean Fuels Standard
- Cap & Trade
- Clean Fuels Standard
- Cap & Trade