
- Markets
- Cap & Trade
- Clean Fuels Standard
- Carbon Offsets
- Carbon Linked Mechanisms
- Get to Know
- Market Coverage
- Cap & Trade
- Clean Fuels Standard
- Carbon Offsets
- Carbon Linked Mechanisms
- Use Cases
- About us
- Membership Plans
- CAFÉ
- Cap-and-Trade
- Clean Fuel Standards
- Carbon Offsets
- InSights
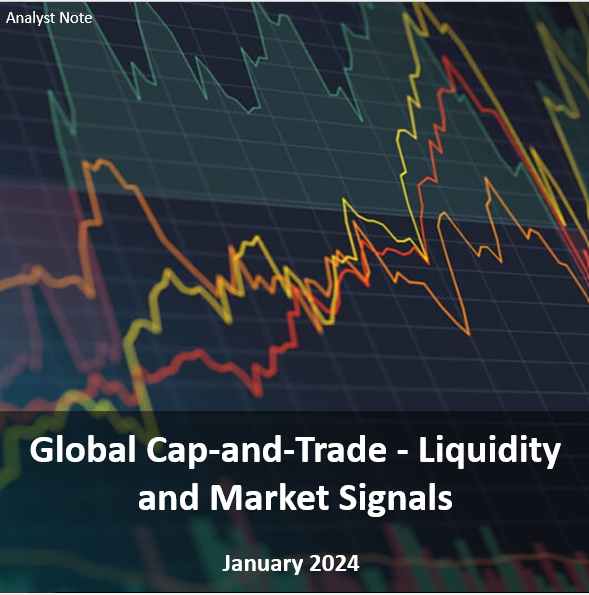
- Global Cap-and-Trade – Liquidity and Market Signals | Analyst Note | January 2024
Global Cap-and-Trade – Liquidity and Market Signals | Analyst Note | January 2024 Wednesday, 24th January 2024
This Analyst Note comprehensively explores the intricate dynamics of the carbon market, focusing on proprietary indices and secondary market matrices. Key metrics such as the Bank, cCinfo Bank Coverage Index, cCinfo Cap Adjusted OI (Open Interest), and cCinfo Bank Adjusted OI index are analyzed to gauge surplus allowances and assess market strength.
 Table of Contents:
- Executive Summary
- Liquidity Measures
- Bank Ratios
- Supply adjusted OI
- Average Future Volume
- Case for Carbon as an investment class
- Correlation Analysis
- Return Volatility
- Sharpe Ratio
- Secondary Market Analyses
- CFTC and ESMA secondary market
- Future Curves in contango
- Annexures
List of Tables
- Table 1. Valuation of Futures Market…………06
- Table 2. Short Term Correlation between Carbon Market and Financial Market……………22
List of Figures
- Figure 1. North America Carbon Market Bank (CCA, RGGI and Washington)……7
- Figure 2. North America Carbon Market Bank Coverage Index (CCA, RGGI and Washington)….08
- Figure 3. European Carbon Market Bank (EU ETS and UK ETS)………..…09
- Figure 4. European Carbon Market Bank Coverage Index (EU ETS and UK ETS)…………10
- Figure 5. North American Carbon Market Bank Adjusted Open Interest (CCA and RGGI)……..11
- Figure 6. North American Carbon Market Cap Adjusted Open Interest (CCA, RGGI and Washington)..12
- Figure 7. European Carbon Market Bank Adjusted Open Interest (EU ETS and UK ETS)………..13
- Figure 8. European Carbon Market Cap Adjusted Open Interest (EU ETS and UK ETS)………14
- Figure 9. CCA Futures Traded Volumes……………15
- Figure 10. RGGI Futures Traded Volumes…………………..…16
- Figure 11. WCA Futures Traded Volumes………………………..……17
- Figure 12. EUA Futures Traded Volumes……………………………………………18
- Figure 13. UKA Futures Traded Volumes…………………………………19
- Figure 14. Long Term Correlation Matrix between Carbon Market and Financial Market…………….21
- Figure 15. Year on Year Price Change (Carbon Market and Financial Market)……23
- Figure 16. Volatility (Carbon Market and Financial Market)……24
- Figure 17. Sharpe Ratio (Carbon Market and Financial Market)………25
- Figure 18. CFTC CCA Net Long Positions…………………27
- Figure 19. ESMA EUA Net Long Positions (ICE ENDEX)……..28
- Figure 20. ESMA EUA Net Long Positions (EEX)…….29
- Figure 21. ICE UKA Net Long Positions…………………30
- Figure 22. CCA Future Volume…………….31
- Figure 23. RGGI Future Volume……………32
- Figure 24. WCA Future Volume……………33
- Figure 25. EUA Future Volume…………….34
- Figure 26 UKA Future Volume……………..35
- Figure 27 CCA Future Curve…………………36
- Figure 28 RGGI Future Curve………………37
- Figure 29 Washington Future Curve……..38
- Figure 30 EU ETS Future Curve…………..39
- Figure 31 UK ETS Future Curve………….40
This report is for members only. Purchase Report
Explore Membership Options to get access to this InSightcCarbon has mapped both the demand as well as supply of SAF to size the market. The research indicates that global SAF consumption in 2022 (as per offtake agreements) stood at 494 million litres.See MembershipsYou might also likeOutlook for Voluntary Renewable Energy and Unbundled Voluntary Certificates in the USA | Insight Report | February 2024 North American Renewable Natural Gas Outlook 2030 | Insight Report | January 2024 North American Renewable Diesel Outlook 2030 | Insight Report | October 2023 View All Insight Forecast Insight Forecast


- Clean Fuel Standards
- Clean Fuels Standard
- Cap & Trade
- Clean Fuels Standard
- Cap & Trade
 Webinar
 Analyst Notes